What are natural resources ETFs?
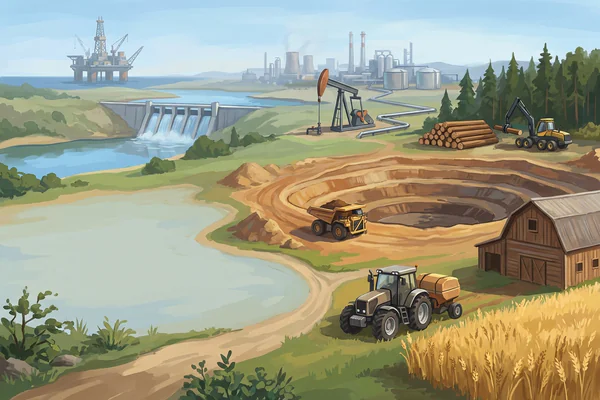
Natural resources ETFs own companies at the start of the supply chain. These include oil and gas producers, metal and gold miners, and farm businesses such as fertilizer and seed makers. The same names turn up again and again. Nutrien is held by 9 of the 13 funds, Corteva by 8, and BHP, Chevron, Newmont and Freeport-McMoRan by 7 each. Exxon Mobil is the single largest holding in GUNR, NANR, IGE and CSNR.
Most funds track an index. GUNR follows the Morningstar Global Upstream Natural Resources Index and HAP the MarketVector Global Natural Resources Index, while GNR and NANR use S&P indexes. NANR and IGE hold only North American companies. GUNR, GNR, HAP and FTRI invest worldwide. CSNR and NRES are actively managed, and MGNR and CCNR pursue their own goals rather than an index. Breadth varies widely. CCNR has 310 holdings with 10.54% in its top ten, while COAL, which tracks a global coal index, has 29 holdings and 63.03% in its top ten. NDIV, renamed the Amplify Energy & Natural Resources Covered Call ETF, writes covered calls. It collects payments called premiums in exchange for giving up some gains above set prices. None of the funds uses leverage or bets on falling prices.
The expense ratio is the yearly fee, taken as a share of what you invest. The median among these funds is 0.46%. NANR is the cheapest at 0.35%, and COAL is the most expensive at 0.85%, with MGNR at 0.75% and FTRI at 0.70% also near the top.
Money is concentrated in a few funds. As of October 27, 2026, the five largest, GUNR, GNR, MGNR, NANR and IGE, held 92.5% of the group's roughly $15.1 billion. GUNR alone held about $7.2 billion, while NDIV, the smallest, held about $26 million.
Natural resources ETF holdings: the stocks most funds own
The stocks that show up most often among the largest positions of the 13 biggest natural resources ETFs with holdings reports, from their latest N-PORT filings.
| Stock | Funds holding it | Typical weight |
|---|---|---|
| Nutrien Ltd. | 9 of 13 | 3.61% |
| Corteva, Inc. | 8 of 13 | 3.27% |
| BHP Group Ltd | 7 of 13 | 4.43% |
| Chevron Corp. | 7 of 13 | 3.72% |
| Newmont Corp. | 7 of 13 | 2.83% |
| Freeport-McMoRan, Inc. | 7 of 13 | 2.75% |
| Exxon Mobil Corp | 6 of 13 | 5.71% |
| Agnico Eagle Mines Ltd. | 6 of 13 | 2.04% |
| Barrick Mining Corp | 4 of 13 | 2.48% |
| Archer-Daniels-Midland Co. | 4 of 13 | 2.11% |
| Canadian Natural Resources Ltd | 3 of 13 | 1.96% |
| Deere & Co | 2 of 13 | 5.69% |
Typical weight is the median share of each fund’s assets in the stock, among the funds that hold it in their 25 largest positions.
The largest natural resources ETFs, side by side
Swipe the table to see all 5 funds.
| GUNR | GNR | MGNR | NANR | IGE | |
|---|---|---|---|---|---|
| Net assets | $7.24B | $4.48B | $841.8M | $735.5M | $707.9M |
| Expense ratio | 0.46% | 0.4% | 0.75% | 0.35% | 0.37% |
| Holdings | 151 | 93 | 40 | 204 | 151 |
| In the 10 largest | 36.56% | 34.94% | 41.34% | 38.84% | 39.99% |
| Biggest holding | ExxonMobil Holdings Corp. (5.08%) | BHP Group Ltd (5.39%) | ArcelorMittal SA (4.73%) | Exxon Mobil Corp (8.87%) | Exxon Mobil Corp. (9.48%) |
| Yield | 2.3% | 2.4% | 0.83% | 1.61% | 1.84% |
| 1-year return | +26.3% | +31.7% | +20.5% | +40.6% | +40.9% |
| 3 years, a year | +14.9% | +16.3% | — | +22.6% | +21.2% |
| 5 years, a year | +10.3% | +11.0% | — | +17.6% | +18.6% |
| Worst drop, past year | -11.7% | -11.0% | -16.6% | -12.3% | -11.6% |
| Launched | 2011 | 2010 | 2024 | 2015 | 2001 |
The largest ordinary funds by net assets (leveraged and inverse funds are listed further down). Holdings from each fund’s latest N-PORT report; returns include reinvested distributions, as of Oct 27, 2026.
Head to head
GUNR vs GNR
GUNR (FlexShares, from Northern Trust) and GNR (SPDR, from State Street) are the two largest funds and both invest worldwide. 51.9% of their assets overlap. GUNR has 151 holdings led by Exxon Mobil at 5.08%; GNR has 93, led by BHP at 5.39%. Both keep about 35% to 37% in their top ten. GNR charges 0.40% a year versus 0.46%. As of October 27, 2026, GNR returned 31.7% over one year against GUNR's 26.3%, with similar worst drops (11.0% and 11.7%). GUNR may suit investors wanting more holdings; GNR, those who prefer the lower fee.
NANR vs IGE
These North American funds have the highest overlap among the five largest: 61.5% of assets and 121 shared holdings. NANR (SPDR) has 204 holdings and charges 0.35%. IGE (iShares), launched in 2001, has 151 and charges 0.37%. IGE leans harder on oil giants, with Exxon Mobil at 9.48% and Chevron at 8.81%, against 8.87% and 6.02% in NANR. As of October 27, 2026, one-year returns were 40.6% and 40.9%, with worst drops of 12.3% and 11.6%. NANR may suit fee-focused investors; IGE, those comfortable with more weight in big oil.
GUNR vs MGNR
These two overlap the least among the five largest funds: 9% of assets and 13 shared holdings. GUNR tracks a Morningstar index across 151 holdings. MGNR, launched in 2024, aims for long-term capital appreciation rather than tracking an index. It has 40 holdings, with 41.34% in its top ten, led by ArcelorMittal at 4.73%. MGNR charges 0.75% versus 0.46%. As of October 27, 2026, MGNR returned 20.5% over one year to GUNR's 26.3%, with a deeper worst drop (16.6% vs 11.7%). MGNR may suit investors wanting something different from the index funds; GUNR, a broad index basket.
How much do the largest natural resources ETFs overlap?
Owning two funds that hold the same stocks adds little diversification. Overlap here is the share of assets two funds have in common: for each stock both own, the smaller of its two weights, added up.
| Funds | Assets in common | Shared holdings | |
|---|---|---|---|
| NANR and IGE | 61.5% | 121 | |
| GNR and NANR | 52.4% | 53 | |
| GUNR and GNR | 51.9% | 49 | |
| GUNR and NANR | 37.2% | 41 | |
| GNR and IGE | 32.6% | 34 | |
| GUNR and IGE | 24.1% | 29 | |
| MGNR and NANR | 21.5% | 27 | |
| GNR and MGNR | 14.2% | 16 | |
| MGNR and IGE | 11.3% | 19 | |
| GUNR and MGNR | 9% | 13 |
From each fund’s full holdings in its latest N-PORT report.
How have natural resources ETFs performed?
The five largest ordinary funds: growth from the start of the range, distributions reinvested. The dashed gray line is the S&P 500 (SPY).
Best-performing natural resources ETFs over the past year
| # | Fund | Net assets | Cost | 1 mo | YTD | 1 yr | 3 yr |
|---|---|---|---|---|---|---|---|
| 1 | IGE iShares North American Natural Resources ETF | $707.9M | 0.37% | +4.9% | +33.0% | +40.9% | +21.2% |
| 2 | NANR SPDR S&P North American Natural Resources ETF | $735.5M | 0.35% | +1.6% | +30.0% | +40.6% | +22.6% |
| 3 | NDIV Amplify Natural Resources Dividend Income ETF | $26.0M | 0.59% | +5.8% | +41.2% | +36.8% | +18.2% |
| 4 | HAP VanEck Natural Resources ETF | $298.8M | 0.41% | -0.9% | +23.2% | +32.0% | +19.7% |
| 5 | GNR SPDR S&P Global Natural Resources ETF | $4.48B | 0.4% | +0.3% | +23.5% | +31.7% | +16.3% |
| 6 | CSNR Cohen & Steers Natural Resources Active ETF | $91.0M | 0.5% | -0.8% | +20.7% | +28.7% | — |
| 7 | GUNR FlexShares Morningstar Global Upstream Natural Re… | $7.24B | 0.46% | 0.0% | +19.4% | +26.3% | +14.9% |
| 8 | NRES Xtrackers RREEF Global Natural Resources ETF | $37.4M | 0.45% | -0.2% | +17.8% | +26.3% | — |
| 9 | CCNR ALPS | CoreCommodity Natural Resources ETF | $427.5M | 0.39% | -2.4% | +17.5% | +25.9% | — |
| 10 | MGNR American Beacon GLG Natural Resources ETF | $841.8M | 0.75% | -6.4% | +10.1% | +20.5% | — |
Funds with at least $25 million in net assets; leveraged and inverse funds left out. Past returns don’t predict future returns.
How natural resources ETFs did in past market crashes
| Fund | 2008 crash | 2020 crash | 2022 drop |
|---|---|---|---|
| GUNR | not yet launched | -39.1% | +1.4% |
| GNR | not yet launched | -41.0% | -3.8% |
| MGNR | not yet launched | not yet launched | not yet launched |
| NANR | not yet launched | -41.8% | +15.6% |
| IGE | -51.5% | -50.8% | +19.9% |
| S&P 500 (SPY) | -55.2% | -33.7% | -24.5% |
Total return from the stock market’s peak to its low in each fall, distributions reinvested.
What drives natural resources ETFs?
The companies in these funds produce oil, gas, metals and farm inputs, and their profits rise and fall with commodity prices. The cost of running a mine or oil field changes slowly. So higher prices flow largely to profit, while a slump squeezes profits just as fast. Commodity prices move with global economic growth, how much new supply producers bring on, weather and harvests for farm businesses, and the US dollar, since most commodities are priced in dollars. Mines and wells take years and large sums to build, so supply often lags demand.
That tie to commodities shows in past downturns. In the 2020 COVID crash, the S&P 500 fell 33.7%, but GUNR fell 39.1%, GNR 41.0%, NANR 41.8% and IGE 50.8%. In the 2022 bear market the pattern reversed. The S&P 500 fell 24.5%, while IGE gained 19.9%, NANR 15.6% and GUNR 1.4%, and GNR slipped just 3.8%. In the 2008 financial crisis, IGE, the only one of the four old enough, fell 51.5%, close to the S&P 500's 55.2%. IGE and NANR, with the heaviest oil stakes, swung furthest in both directions.
Natural resources ETFs with the lowest expense ratios
| # | Fund | Expense ratio | On $10,000 | Net assets |
|---|---|---|---|---|
| 1 | NANR SPDR S&P North American Natural Resources ETF | 0.35% | $35 a year | $735.5M |
| 2 | IGE iShares North American Natural Resources ETF | 0.37% | $37 a year | $707.9M |
| 3 | CCNR ALPS | CoreCommodity Natural Resources ETF | 0.39% | $39 a year | $427.5M |
| 4 | GNR SPDR S&P Global Natural Resources ETF | 0.4% | $40 a year | $4.48B |
| 5 | HAP VanEck Natural Resources ETF | 0.41% | $41 a year | $298.8M |
Ordinary funds with at least $10 million in net assets. The median ordinary natural resources ETF charges 0.46% a year; leveraged and inverse funds usually charge more.
Do natural resources ETFs pay dividends?
13 of the 13 ordinary natural resources ETFs with a page here paid distributions over the last 12 months, with a median yield of 2.07%.
| Highest yields | Yield | Net assets |
|---|---|---|
| NDIV Amplify Natural Resources Dividend Income ETF | 8.63% | $26.0M |
| CCNR ALPS | CoreCommodity Natural Resources ETF | 2.96% | $427.5M |
| COAL Range Global Coal Index ETF | 2.46% | $58.9M |
| GNR SPDR S&P Global Natural Resources ETF | 2.4% | $4.48B |
| GUNR FlexShares Morningstar Global Upstream Natura… | 2.3% | $7.24B |
Distributions over the last 12 months divided by the price; funds with at least $25 million in net assets. Some of these yields come from selling options, which gives up some of the gains.
How to choose a natural resources ETF
- Fees run from 0.35% to 0.85%. NANR charges 0.35% a year and IGE 0.37%. CCNR, GNR and HAP follow at 0.39% to 0.41%. MGNR, at 0.75%, and COAL, at 0.85%, cost more than twice NANR's fee. The median is 0.46%.
- Worldwide or North America only. NANR and IGE track North American companies, and Exxon Mobil and Chevron are their two largest holdings. GUNR, GNR and HAP invest worldwide, adding names such as BHP, Shell and Iberdrola, which also adds foreign-currency exposure.
- Broad baskets or narrow themes. CCNR spreads money across 310 holdings, with only 10.54% in its top ten. COAL tracks a global coal index with 63.03% in its top ten, and FTWO mixes resources with national-security names such as GE Aerospace.
- Index rules or active managers. Most funds, including GUNR, GNR, NANR, IGE and HAP, follow an index. CSNR and NRES are actively managed. MGNR and CCNR pursue goals such as capital appreciation or real returns (after inflation) rather than tracking an index.
- Fund size and length of record. GUNR and GNR hold far more money than the rest; NDIV holds about $26 million. MGNR, CCNR, CSNR, NRES and COAL launched in 2024 or 2025, so their track records are short. Very small funds are more likely to close.
- Covered-call income changes the trade-off. NDIV tracks a covered-call index. It collects payments, called premiums, in exchange for giving up some gains above set prices. That helps explain its 8.63% yield as of October 27, 2026, but limits its gains in strong rallies.
What are the risks of natural resources ETFs?
- Big bets on Exxon Mobil and Chevron. The North American funds lean hard on two oil giants. Exxon Mobil made up 9.48% of IGE and Chevron 8.81%, while Exxon was 8.87% of NANR. Trouble at the big oil companies would weigh heavily on these funds.
- Sharp falls when commodities slump. These funds rise and fall with oil, metal and crop prices. In the 2020 COVID sell-off, IGE fell 50.8%, NANR 41.8% and GNR 41%, while the S&P 500 dropped 33.7%. Retirees selling for income would lock in losses.
- Narrow funds pack risk into few stocks. Some funds bet on few companies. COAL has 29 holdings, with 63.03% in its top ten. In the year to October 27, 2026, it swung more than any peer and fell as much as 21.7% from a high.
- Owning two funds may mean double exposure. Many funds hold the same companies. Nutrien sits in 9 of the 13 funds and Corteva in 8. NANR and IGE share 121 holdings, a 61.5% overlap, so owning both adds little variety.
- Covered calls cap NDIV's upside. NDIV follows a covered call index. It sells call options, contracts letting buyers purchase its stocks at set prices. The payments it collects help fund its 8.63% yield but limit gains when prices jump. Losses are not capped.
List of all natural resources ETFs, by size
| # | Fund | Net assets | Cost | Yield | YTD | 1 yr | 5 yr |
|---|---|---|---|---|---|---|---|
| 1 | GUNR FlexShares Morningstar Global Upstream Natural Re… | $7.24B | 0.46% | 2.3% | +19.4% | +26.3% | +10.3% |
| 2 | GNR SPDR S&P Global Natural Resources ETF | $4.48B | 0.4% | 2.4% | +23.5% | +31.7% | +11.0% |
| 3 | MGNR American Beacon GLG Natural Resources ETF | $841.8M | 0.75% | 0.83% | +10.1% | +20.5% | — |
| 4 | NANR SPDR S&P North American Natural Resources ETF | $735.5M | 0.35% | 1.61% | +30.0% | +40.6% | +17.6% |
| 5 | IGE iShares North American Natural Resources ETF | $707.9M | 0.37% | 1.84% | +33.0% | +40.9% | +18.6% |
| 6 | CCNR ALPS | CoreCommodity Natural Resources ETF | $427.5M | 0.39% | 2.96% | +17.5% | +25.9% | — |
| 7 | HAP VanEck Natural Resources ETF | $298.8M | 0.41% | 1.84% | +23.2% | +32.0% | +12.2% |
| 8 | FTRI First Trust Indxx Global Natural Resources Income… | $121.7M | 0.7% | 2.07% | +9.6% | +13.8% | +10.6% |
| 9 | CSNR Cohen & Steers Natural Resources Active ETF | $91.0M | 0.5% | 1.77% | +20.7% | +28.7% | — |
| 10 | FTWO Strive Natural Resources and Security ETF | $73.1M | 0.49% | 0.94% | +10.4% | +12.8% | — |
Questions investors ask about natural resources ETFs
What is the largest natural resources ETF?
GUNR, the FlexShares Morningstar Global Upstream Natural Resources Index Fund from Northern Trust, is the largest, with about $7.2 billion in net assets. It tracks a Morningstar index of upstream companies, those at the start of the supply chain such as oil producers, miners and farm-supply businesses. It has 151 holdings and charges 0.46% a year. GNR from State Street is next, at about $4.5 billion. As of October 27, 2026, the five largest funds held 92.5% of the group's assets.
What is the cheapest natural resources ETF?
NANR, the SPDR S&P North American Natural Resources ETF, has the lowest expense ratio at 0.35% a year. IGE from iShares is close behind at 0.37%, followed by CCNR at 0.39%, GNR at 0.40% and HAP at 0.41%. The median fund charges 0.46%, and the most expensive, COAL, charges 0.85%. NANR and IGE hold only North American companies, while GNR and HAP invest worldwide.
GUNR vs GNR: what is the difference?
GUNR is larger and has more holdings; GNR costs less. Both are global natural resources index funds, and 51.9% of their assets overlap. GUNR, from Northern Trust, has 151 holdings led by Exxon Mobil at 5.08% and charges 0.46% a year. GNR, from State Street, has 93 holdings led by BHP at 5.39% and charges 0.40%. As of October 27, 2026, GNR returned 31.7% over one year against GUNR's 26.3%. Five-year figures were closer, at 11.0% and 10.3%.
Do natural resources ETFs pay dividends?
Yes. All 13 funds pay dividends, and the median yield was 2.07% as of October 27, 2026. NDIV had the highest at 8.63%. It is a covered-call fund, so its payouts can include option premiums as well as stock dividends. CCNR yielded 2.96%, COAL 2.46%, GNR 2.4% and GUNR 2.3%. MGNR yielded just 0.83%; its stated goal is long-term capital appreciation.
Do natural resources ETFs hold Exxon Mobil?
Many do. Exxon Mobil is the largest holding in IGE (9.48%), NANR (8.87%), CSNR (5.71%) and GUNR (5.08%). It also ranks among the five largest in FTWO, HAP, GNR and NRES. Other widely held names are Nutrien, in 9 of the 13 funds, Corteva, in 8, and Chevron, in 7. Funds with other focuses, such as COAL and NDIV, do not list Exxon among their five largest holdings.
How many natural resources ETFs are there?
There are 13 US-listed natural resources ETFs, holding about $15.1 billion in total as of October 27, 2026. They range from GUNR, at about $7.2 billion, to NDIV, at about $26 million. IGE is the oldest, launched in 2001, while MGNR, CCNR, CSNR, NRES and COAL all launched in 2024 or 2025. None uses leverage or bets against the sector, but NDIV writes covered calls for income.
Is there a Vanguard natural resources ETF?
No. None of the 13 US-listed natural resources ETFs comes from Vanguard. The largest are run by Northern Trust (GUNR), State Street (GNR and NANR), Resolute Investment Managers (MGNR, an American Beacon fund) and iShares (IGE). VanEck (HAP), First Trust (FTRI), ALPS (CCNR) and Cohen & Steers (CSNR) offer others. Among the lower-cost options, NANR charges 0.35% a year and IGE 0.37%.
Which natural resources ETF has the highest return?
IGE had the highest one-year return, 40.9% as of October 27, 2026, just ahead of NANR at 40.6%. Both hold only North American companies, with large stakes in Exxon Mobil and Chevron. COAL had the lowest at 11.4%, and the median fund returned 26.3%. Among funds with five-year records, IGE (18.6%) and NANR (17.6%) also led. Past returns do not predict future results; in the 2020 COVID crash, IGE fell 50.8% and NANR 41.8%.
Is there a Vanguard, Fidelity or Schwab natural resources ETF?
No. None of the three offers a natural resources ETF. The largest natural resources ETFs come from Northern Trust (GUNR), SPDR (State Street) (GNR) and Resolute Investment Managers, Inc. (MGNR), and customers of all three firms can buy other companies’ ETFs in their brokerage accounts.